When and how did you develop an interest in mapmaking?
I don’t know, not exactly. How many of us have a firm grasp on their pre-school years? I’ve guessed that my first map might have been one in Virginia Lee Burton’s Katy and the Big Snow. Katy came out in 1943, a couple of years before I was born. My mother read it to me when I was very young…It was easy to follow and make sense of.
The map is a glorious two-page ‘Map of City of Geoppolis,’ wreathed with keyed vignettes of city departments and schools, the train station and the airport. It’s a bird’s-eye view, but of course the Big Snow buries it and then Katy has to dig it out, page after exciting page. The thing is, this meant it was no longer just a map, but a whole narrative about digging it out: if you could imagine Katy was a crayon, you could imagine drawing the map yourself!
Did I have this insight then? I don’t know. Doubtful. But there the map was, along with an incredible number of other map-like high-obliques, so that when, at age seven or eight, I came across J. R. R. Tolkien’s The Hobbit in my grandfather’s attic and found in it this sentence, “He loved maps, and in his hall there hung a large one of the Country Round with all his favorite walks marked on it in red ink” – in a volume decked out with maps on both endpapers (marked on in red ink!) – I was all ready to mark out my own favorite walks on a map I would make of my Country Round. In red ink! Actually I didn’t have any favorite walks, which I thought about as something I did rather than had, but Tolkien sparked a commitment.
You started making maps even in elementary school. What were the first maps you created depicting?
Around the same time – it would have been the third grade – I remember writing, in ascending order, my name, my address, my city, my county, my state, my country, my continent, my planet, and my solar system. I remember trying to draw it too, no trouble with the planet and the solar system, but I was unsure about my address, city, and county. For one thing I didn’t live on a street but on a court: six apartment buildings facing each other across a lawn and a paved play space. I wasn’t sure how to think about this. It was in a federal housing project down where Cleveland’s Cuyahoga River runs into Lake Eire. Between me and the lake were a few blocks of industrial landscape; behind me Cleveland’s West Side, into which large numbers of central Europeans had been migrating. It was a complicated place, but it was where I lived. It was challenging, but it was my Country Round. And the city and the county? No idea at all how to draw them, or even what they looked like.
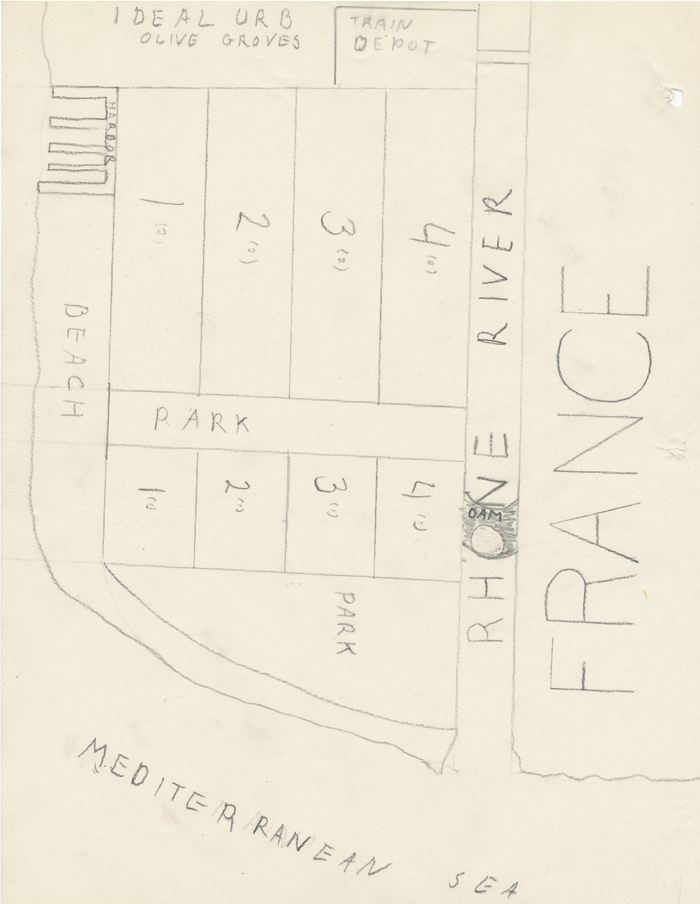
I don’t have any of the maps I drew in those days. All I managed to hang onto was the plan for a house and grounds I was designing, and the plan for an ideal city I was proposing to go where the Rhone flowed into the Mediterranean. These would have been in the fifth and sixth grades. I was a precocious lunatic.
What influences shaped your fight against cartography?
Well, I’d grown up looking at maps. But there were the maps in Winnie-the-Pooh, The Wind in the Willows, Fritz Mühlenweg’s Big Tiger and Christian and all the rest of them, and you know, almost none of them had neat lines and legends and scale bars and graticule tick marks. And when I started taking cartography and was told all maps had to have those – and others! – I was made restive. And then I was always a rebellious kid, encouraged by my parents to disesteem, even to fight against the standards touted by my teachers for art, for music, for politics.
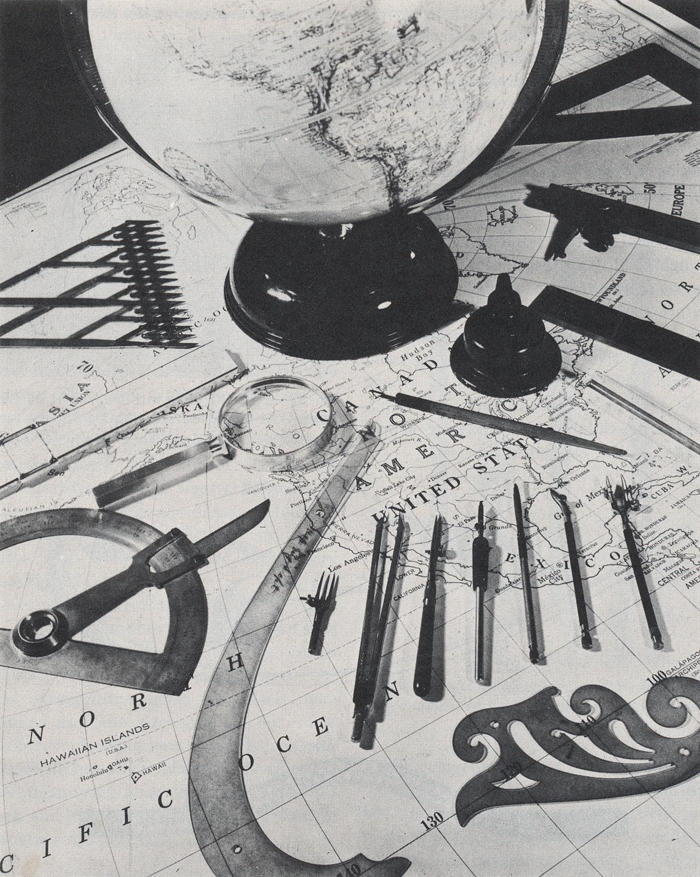
I have to admit I didn’t take cartography until I was a graduate student. It mostly drove me nuts. This was back in the day when maps were made by hand, ruling pens, French curves, splines, Leroy scribers, bottles of ink. We all had K+E drafting sets. It was Late Medieval, and not just the making of the maps: the thinking about them was medieval too. But I liked the people and I ended up taking a few seminars that George McCleary offered about maps and these gave me a chance to contest the dogma in all its forms.
Another thing that happened was psychogeography, an interest in the geography people carried around in their heads. During spring break in my first year I asked a hundred high school students in San Cristobal las Casas (in Chiapas, in Mexico, where by then I’d spent a lot of time) to draw maps of their city. A year later, after collecting another two hundred maps from these students, I turned them all into Fleeting Glimpses, my master’s thesis. The following year I accompanied a busload of American high school students on their first trip to Europe, collecting maps from them day after day, especially of the cities they spent much time in. This turned into my doctoral dissertation, I Don’t Want To, But I Will.
So all this – medieval methods, restrictive notions about cartographic propriety, and my work in mental mapping – set me up to, well, fight cartography as she was writ in the university.
What old notions of maps were you hoping to challenge?
It wasn’t maps that I was at war with, it was cartography. Cartography presented this notion that there was a way to make maps, the right way, the professionally sanctioned way; and this included all these notions about accuracy and precision that just flew in the face of maps I admired, maps I loved. For example, there was a map of Japan that Time-Life Books published in 1969 in The Cooking of Japan. This consisted of a few black brushstrokes on a light tan background with seventeen cities called out in red. They, the four big islands, and three bodies of water were named. It was gorgeous! But it lacked all the stigmata of a cartographic product: accuracy sacrificed, precision thrown overboard, neat line, projection, scale, all done without. Yet it was the kind of map I yearned to make.
Tell us all about how your map work started.
I didn’t end up in cartography, or even geography. I ended up teaching high school in Worcester, Massachusetts, and in a desultory fashion applying for jobs in geography. I was in my second year of this when I was asked to apply for a position in the landscape architecture department in the School of Design at North Carolina State University. I knew less than zero about landscape architecture, but it sure beat being in a geography department, so I ended up moving to Raleigh. I was assigned a landscape architecture studio – twelve contact hours a week – and, panicked for something to do, I ended up having the students make maps of a local neighborhood. It was, I suggested, a way of familiarizing themselves with an environment; and not “regular” maps either, but maps of the way the land smelled, of the way it felt in their legs when they walked it, of the sound of the wind in the oaks after all the other leaves had fallen, of the way twilight made all the difference. The maps were fun to make, and because landscape architecture students are design students, there was both an attention to polish as well as an imaginative drive to map the least “mappable” things.
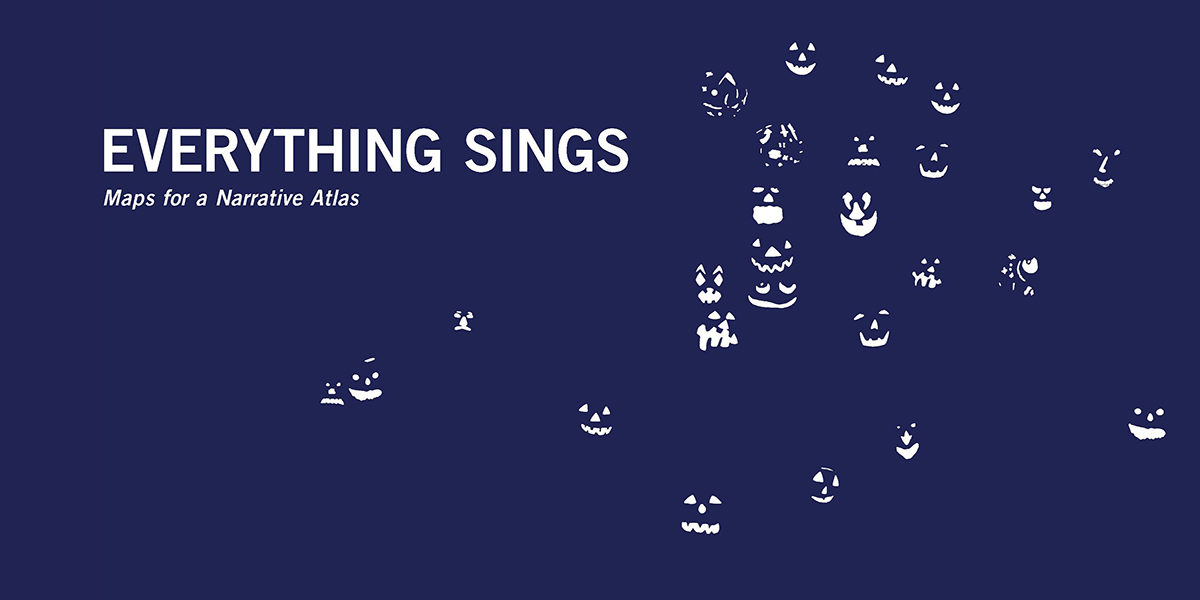
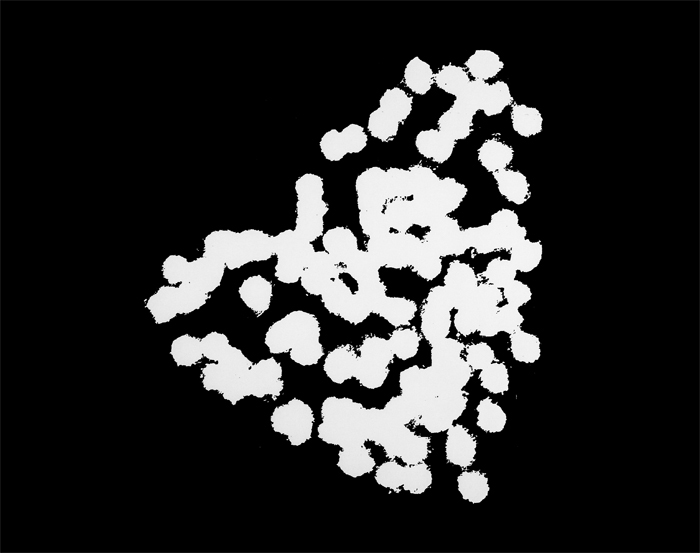
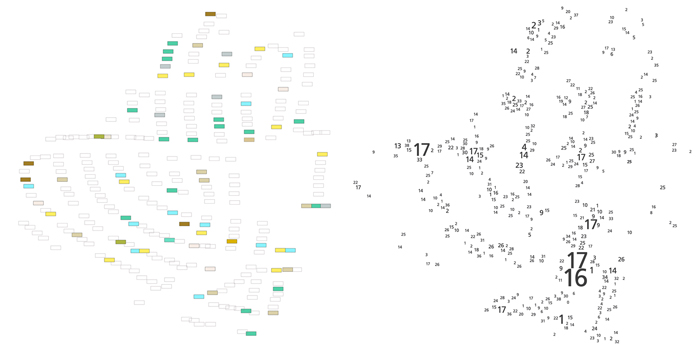
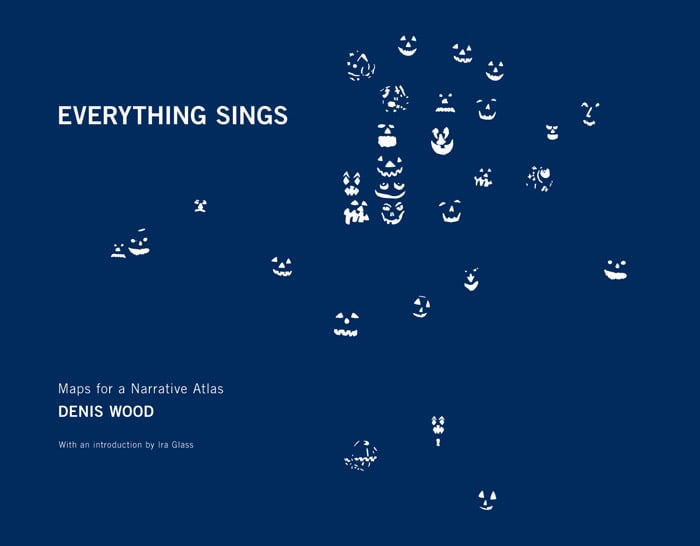
In 1982 I, a colleague, and a bunch of graduate students began work on an atlas of Boylan Heights. We were working on a map of street lights when we began paring away the inessential, the map crap (the neat line, the scale, the north arrow), the neighborhood boundaries, the topography, finally the streets, first the scaled streets, next a schematic grid of the streets, and finally even a hint of a grid of the streets. Daylight went too – the default daylight most maps take for granted – so that we were fooling around with circles of white on a black background. It became clear that this wasn’t a map of the lamp posts, but of the lamp light, and light wasn’t something we knew how to deal with. Certainly the uniform white circles we’d been drawing caught nothing of the way the light was fringed as you moved away from it, but I had a pochoir brush at home and when Carter Crawford – who’d put himself in charge of atlas graphics – used it to draw the circles it was magical.
You know, I’ve told this story a thousand times, but it’s when I began to understand anything at all about making maps. And after you’ve done it once, it turns out to be easy to do again. And again.
Tell us about your mapmaking process.
So that streetlight map took a couple of weeks to make, and that was after walking through the neighborhood to map the locations of the streetlights, so maybe three weeks altogether. Something in there. But most of my effort in making a map goes into the collection of the data. Even as I confess that, it may have taken weeks to get to the point of understanding what data is required. After that it’s mulling it over. Back when I started this, before computers, it all took a lot longer than it does these days. Adobe’s Illustrator has become an indispensable tool. Once I’ve got an idea I try to make the map, and I keep working on it until it’s done. Very rarely do I remake a map. But each map does take a while. I stare at blank paper a lot.
How do you go about translating data on a map? Are there any patterns or details that you look for and any information you try to include in your maps?
These days I import the best base material I can find into Illustrator, lock it in place, and open other layers to work in. In the end I delete the base material, leaving me with my … annotations. In the case of Boylan Heights we have very high resolution imagery to work with as, these days, we have for the whole rest of the world. Or most of it anyway. Data’s another problem. For the things I like mapping it’s often necessary to go into the world and collect it.
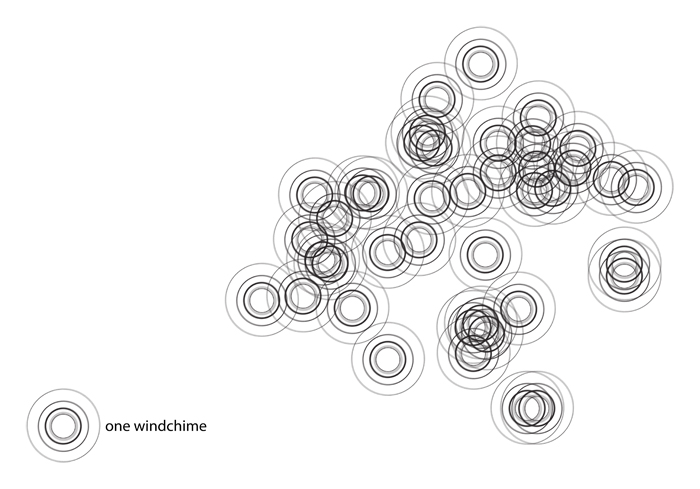
As for what I want on my maps, I want my data as simple and clear as possible. I do love color, but working in black and white as I usually do is a way of keeping things really simple, which is how I like it. The patterns I’m looking for are those that reveal something about the subject, something interesting, class structure, income levels, and history. It’s astonishing how easily these can be read from maps. But I’m also looking for data that reveal aspects of everyday life that can all too easily be taken for granted. I’m interested in place, so what are the signs that mark a place? What are the things that make it unique?
What is the mind of a mapmaker like? Do you find yourself turning things into maps in your mind?
I do spend a lot of time in the world wondering about how the things I’m seeing are … laid out. I’m often filled with a desire to see things from overhead. My problem is that often the things I want to see from overhead aren’t really visible from overhead. They’re obscured by tree cover or roofs or soil or streets; or they’re things that can’t be seen, sounds, smells, temperatures, rates. And more important than how they’re laid out is what I imagine might be behind the layout, the interconnections among things. That’s what really interests me, how all the parts of a system conspire to produce the world we experience. It’s not cause and effect, its causes and effects, their complex intermingling. I do believe there’s a spatial dimension to everything, so anything can be the subject of mapping. Even though the pattern might seem self-evident, even then it often turns out to be useful to lay it out.
Do you have a personal favorite from your map collection?
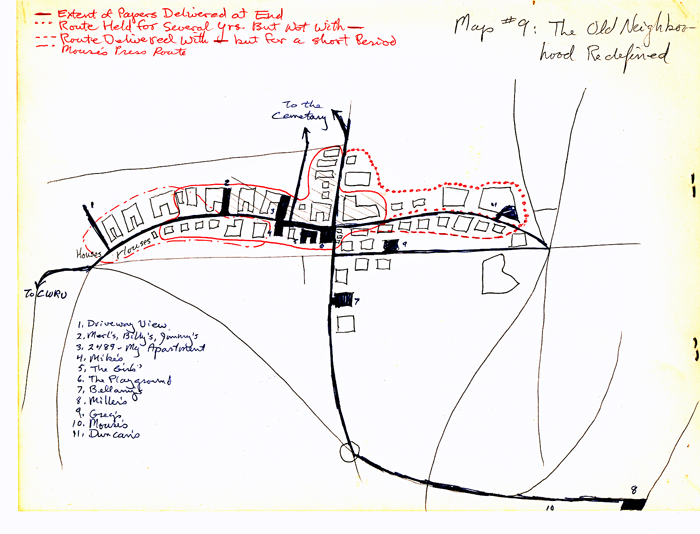
I suppose the map I most love is that break-through streetlight map, though I’m almost equally enamored of the sketch maps I made after I’d started graduate school, and had discovered what J. K. Wright called geosophy, of the neighborhood I’d lived in in Cleveland Heights. Geosophy’s the study of the earth as the home of man from any and all points of view. I understood this to mean from my point of view as well, and I immediately launched myself into thinking about, and sketching maps of the neighborhood I’d moved into in the sixth grade. These were the crudest sketch maps, but recently I published a bunch of them in a paper called “The Paper Route Empire” in the book from London’s Visual Editions called Where You Are. The empire were the paper routes I delivered for ten year in the ’50s and ’60s, well, paper route in the beginning, but soon enough routes, four of them most of the time. One of the things making these maps did was allow me to imagine mapping my own environment once I’d moved to Raleigh, so it was a critical part of the background I brought to the decision to have that first studio start making maps of the neighborhoods we lived in.
What do you want people to take away from viewing your maps?
The things I think I put in them, that is, the relationships among the things on the map, and between the maps. My hope is, having read Everything Sings, my atlas of Boylan Heights, that you have some idea not only of its physical layout, but of its social structure, its place in Raleigh, its history; as when you’ve finished “The Paper Route Empire” you have some sense of what it was like for me to grow up in Cleveland Heights. I’d be happy if you liked the way the maps lay on the page, too, the way they looked. I think they’re handsome things, though I also think they’re smart. Smart and good-looking: isn’t that the way we want people to view us? If us, why not our maps?
Since this week is Geography Awareness, what advice would you give for families to engage with geography?
To always know where whatever is being talked about or written about or looked at is. I think knowing where things are is profoundly clarifying, whereas not knowing where things are is confusing. If you pay attention to where things are, after a while patterns begin to emerge, and those patterns have powerful explanatory power. They help make sense of the news, and understanding what’s going on helps make sense of life. These patterns have historical dimensions too, and understanding that is immensely helpful. It’s time and space together: you never have one without the other. The world is a four dimensional construct. But you can never make sense of history without knowing where things are. Just as geography is pretty meaningless without history. The fact is, you can’t know too much, but you can sure know too little!
Has your work in mapmaking impacted other areas in your life?
It’s made me more attentive. It’s made me more attentive to the details of place, but also to the larger structures to which those details point. Otherwise it’s more the way that other areas of my life have impacted my mapmaking, my thinking about maps generally. I’ve argued that when thinking about maps is limited to maps, just about everything relevant is overlooked. Thinking about maps intelligently requires thinking about all life, especially these days now that maps are interwoven into so much of life.
What’s next for you?
John Krygier and I have a new edition of Making Maps coming out this spring. It continues our effort to write a “cartography textbook” wholly without words. We haven’t achieved that yet, but this edition does expand our use of the comic strip that we introduced in the second edition, and replaces still more words with pictures. And Joe Bryan and I are working on getting Weaponizing Maps translated into Spanish. Life’s an adventure and I’ve always been surprised about where it’s taken me. I’m looking forward to a lot more surprises!
We hope Denis’ work has inspired you to think differently about maps. With maps being more present everywhere from your smartphone to news articles and even to fantasy books, maps are less intimidating than ever before. Mapmaking and geography are less about specialized skills but more about the way we think about our surroundings and how spaces and places play a role. With that mindset, you are already on your way to becoming a geographer. And if you make quick drawings of your neighborhood and notice all the details like Denis Wood does, you will become a mapmaker.